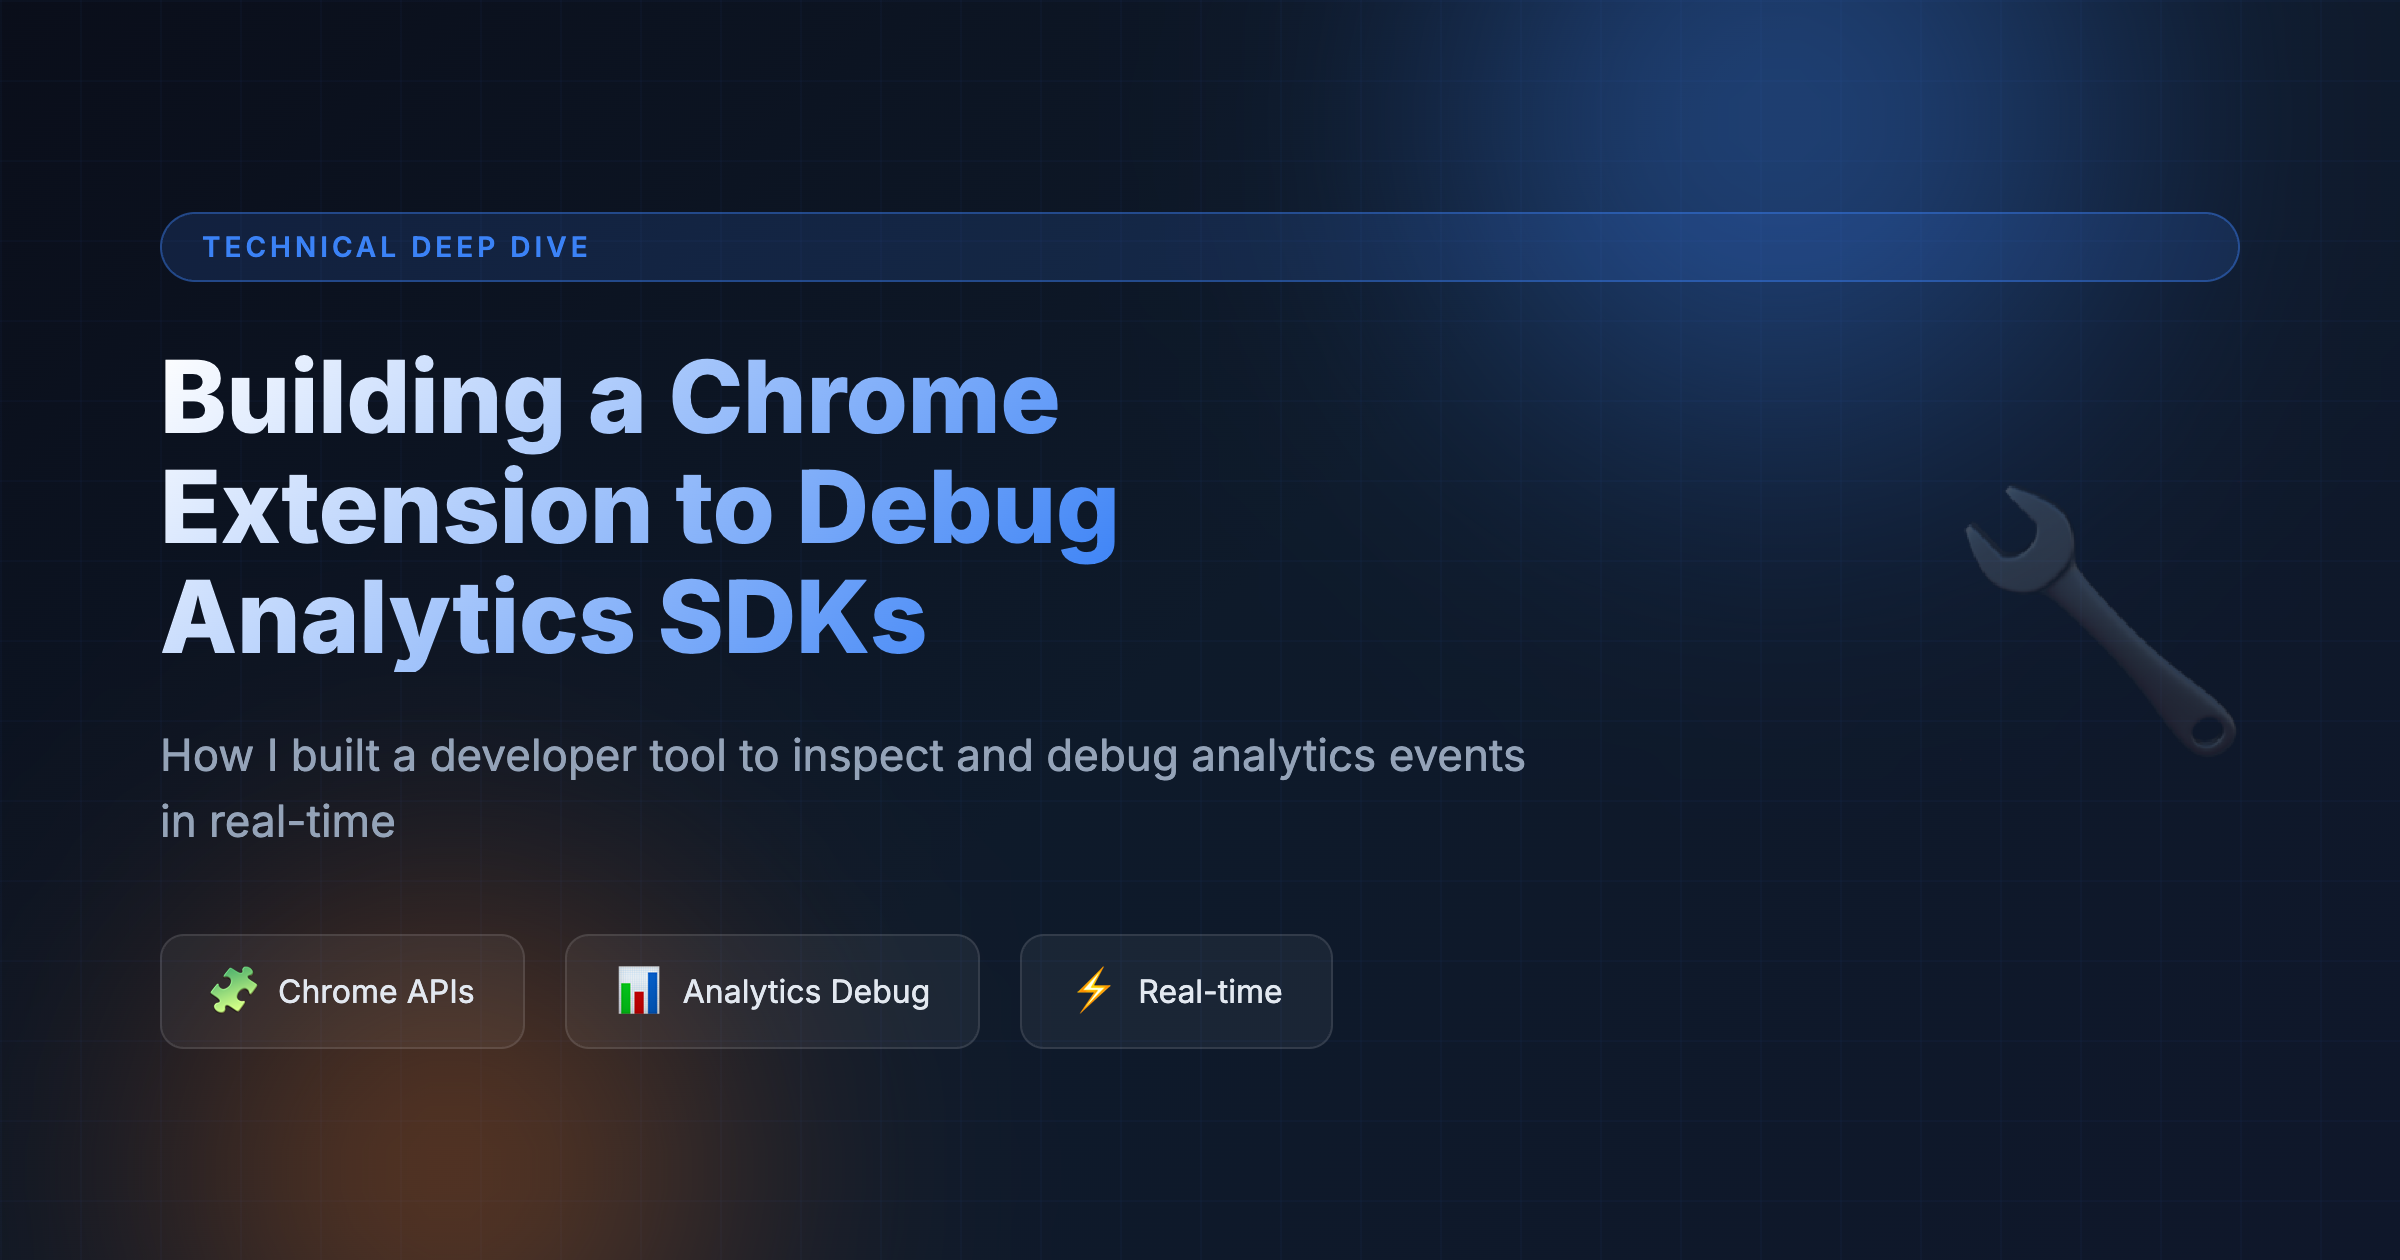
If you’ve ever worked with analytics SDKs, you know the pain. Someone reports that form submissions aren’t being tracked. Or user identification calls are mysteriously failing. You open Chrome DevTools, navigate to the Network tab, try to filter requests, and… you’re hunting through hundreds of API calls, most of which are encoded in some proprietary format.
At Factors, I faced this problem constantly while helping customers debug their SDK implementations. The questions were always the same:
- “Is the SDK even loading?”
- “Is it loading via our website or through Google Tag Manager?”
- “Are the network calls going through?”
- “What data is actually being sent?”
- “Why aren’t our forms being tracked?”
I needed a tool that could answer all of these instantly. So I built one.
What I Built
The Factors SDK Debugger is a Chrome extension that:
- Detects SDK presence – Not just “is it there?” but how it is installed (manual HTML, Google Tag Manager, or both)
- Intercepts ALL network requests – Including
fetch(),XMLHttpRequest, andsendBeacon() - Decodes encrypted payloads – The SDK uses Caesar cipher encoding; the extension decodes everything automatically
- Tracks forms in real-time – Scans the DOM, including iframes, to show which forms are being tracked
- Persists data across navigations – Data stays available even as users navigate around a site
But the interesting part isn’t what it does—it’s how it does it.
The Technical Deep Dive
Challenge #1: Running Code in the Page’s JavaScript Context
Chrome extensions run in an “isolated world” by default—a separate JavaScript context from the page. This is great for security but terrible for intercepting network calls that the page makes.
The solution? Chrome’s Manifest V3 introduced world: "MAIN" for content scripts:
{
  "content_scripts": [
    {
      "matches": ["<all_urls>"],
      "js": ["content/interceptor.js"],
      "run_at": "document_start",
      "world": "MAIN",  // Run in page context, not isolated world
      "all_frames": true
    }
  ]
}
This lets my interceptor script monkey-patch fetch, XMLHttpRequest, and navigator.sendBeacon before any page scripts run.
Challenge #2: Capturing Requests Before They Leave
Here’s how I intercept sendBeacon (commonly used by analytics SDKs):
const originalBeacon = navigator.sendBeacon.bind(navigator);

navigator.sendBeacon = function (url, data) {
  if (isFactorsUrl(url)) {
    // Capture the request data before it's sent
    sendNetworkRequest({
      url: url,
      method: 'POST',
      requestBody: data,
      timestamp: Date.now(),
      type: 'beacon',
      pageUrl: window.location.href
    });
  }

  return originalBeacon(url, data);
};
The key insight: I capture the data before calling the original function. This means I get the full request body, which Chrome DevTools’ Network tab often can’t show for sendBeacon calls.
Challenge #3: Dual-Layer Capture for 100% Coverage
What if my content script injection fails? What if there’s a race condition? I built a dual-layer approach:
Layer 1: Content Script Injection (Primary)
- Runs in
MAINworld atdocument_start - Intercepts network APIs directly
- Gets full request bodies
Layer 2: Service Worker with webRequest API (Backup)
- Uses Chrome’s
webRequest.onBeforeRequest - Catches any requests that slip through
- Provides deduplication to prevent double-counting
// Service worker backup layer
chrome.webRequest.onBeforeRequest.addListener(
  async (details) => {
    if (!isFactorsCall(details.url)) return;

    const timestamp = Date.now();

    // Check if content script already captured this
    if (isRequestDuplicate(details.url, timestamp, 'webRequest')) {
      return; // Skip - content script got it
    }

    // Store the request...
  },
  { urls: ['<all_urls>'] },
  ['requestBody']
);
Challenge #4: Decoding Obfuscated Payloads
The Factors SDK encodes all request bodies using a Caesar cipher (shift = 4). Instead of making users decode this manually, the extension does it automatically:
function decodeFactorsPayload(str, shift = 4) {
  if (!str || typeof str !== 'string') return str;

  let decoded = '';
  const first = 33 + shift; // 37

  for (let i = 0; i < str.length; i++) {
    const charCode = str[i].charCodeAt(0);

    if (charCode >= first && charCode <= 126) {
      decoded += String.fromCharCode(charCode - shift);
    } else if (charCode < first && charCode >= 33) {
      // Handle wrap-around
      decoded += String.fromCharCode((charCode % 33) + (126 - shift) + 1);
    } else {
      decoded += str[i];
    }
  }

  return decoded;
}
Now users see clean JSON payloads instead of gibberish.
Challenge #5: Detecting Manual vs GTM Implementation
This was surprisingly tricky. The SDK creates a <script> element dynamically, so you can’t just check for <script src="factors.js"> in the HTML.
My approach:
- Fetch the raw HTML source with XHR (not the DOM, which includes dynamic scripts)
- Search for the SDK stub pattern in the raw HTML
- If found in raw HTML → Manual implementation
- If only in DOM (not raw HTML) → Dynamic/GTM implementation
- If both → Flag as duplicate installation (often a bug!)
const SDK_PATTERNS = {
  // The initialization pattern (always present in the stub)
  faitrackerInit: /window\.faitracker\s*=\s*window\.faitracker\s*\|\|/i,
  // Constants that confirm it's the actual stub
  faitrackerConst: /FAITRACKER_QUEUED_EVENT|FAITRACKER_INIT_EVENT/i
};

function checkRawHtmlSource() {
  const xhr = new XMLHttpRequest();
  xhr.open('GET', window.location.href, true);
  xhr.onreadystatechange = function () {
    if (xhr.readyState === 4 && xhr.status === 200) {
      const html = xhr.responseText;
      const hasFactorsInSource =
        SDK_PATTERNS.faitrackerInit.test(html) &&
        SDK_PATTERNS.faitrackerConst.test(html);

      if (hasFactorsInSource) {
        // It's a manual implementation
      }
    }
  };
  xhr.send();
}
Challenge #6: Real-Time Form Detection with Iframe Support
Tracking forms is more complex than you’d think. Forms can be:
- Static in the HTML
- Dynamically added by JavaScript
- Inside same-origin iframes (like embedded HubSpot forms)
- Modified after initial load
My solution polls the DOM every 5 seconds, extracting forms from both the main document and accessible iframes:
function extractFormsFromDocument(doc, sourceLabel) {
  const forms = [];
  const formElements = doc.querySelectorAll('form');

  formElements.forEach((form, index) => {
    forms.push({
      id: form.id || null,
      name: form.getAttribute('name') || null,
      action: form.getAttribute('action') || null,
      method: (form.getAttribute('method') || 'GET').toUpperCase(),
      source: sourceLabel,
      index
    });
  });

  return forms;
}

function detectAllForms() {
  const detectedForms = [];

  // Extract forms from current document
  const currentDocForms = extractFormsFromDocument(document, 'main');
  detectedForms.push(...currentDocForms);

  // Check inside same-origin iframes
  const iframes = document.querySelectorAll('iframe');
  iframes.forEach((iframe, index) => {
    try {
      const iframeDoc = iframe.contentDocument;
      if (iframeDoc) {
        const iframeForms = extractFormsFromDocument(iframeDoc, `iframe-${index}`);
        detectedForms.push(...iframeForms);
      }
    } catch (e) {
      // Cross-origin iframe - can't access
    }
  });

  return detectedForms;
}
The extension also checks for specific tracking attributes (data-faitracker-form-bind, data-faitracker-input-id) to show users exactly which forms and fields the SDK is monitoring.
Lessons Learned
1. Race Conditions Are Everywhere
Network interceptors, content scripts, service workers—they all run at different times. I implemented:
- Request buffering with sequence numbers
- Debounced batch sending (50ms window)
- Deduplication using URL + timestamp as keys
2. Storage Requires Locking
Multiple requests can trigger storage updates simultaneously. I built a simple async lock:
const storageLocks = new Map();

async function withStorageLock(domain, operation) {
  while (storageLocks.has(domain)) {
    await storageLocks.get(domain);
  }

  let releaseLock;
  const lockPromise = new Promise((resolve) => {
    releaseLock = resolve;
  });

  storageLocks.set(domain, lockPromise);

  try {
    return await operation();
  } finally {
    storageLocks.delete(domain);
    releaseLock();
  }
}
3. The Extension Must Be Invisible Until Needed
Users don’t want to think about debugging tools until something breaks. The extension:
- Shows a checkmark badge when the SDK is detected
- Automatically cleans up data after 24 hours
- Groups network calls by page URL for easy navigation
The Architecture
┌─────────────────────────────────────────────────────────────────┐
│                         Browser Page                            │
│                                                                 │
│  ┌─────────────────┐    ┌────────────────────┐                  │
│  │  interceptor.js │    │  content-script.js │                  │
│  │  (MAIN world)   │───▶│  (Isolated world)  │                  │
│  │                 │    │                    │                  │
│  │ • Patches fetch │    │ • Bridges messages │                  │
│  │ • Patches XHR   │    │ • Buffers requests │                  │
│  │ • Patches beacon│    │ • Detects forms    │                  │
│  └─────────────────┘    └────────────────────┘                  │
│                                   │                              │
└───────────────────────────────────┼──────────────────────────────┘
                                    │
                                    ▼
              ┌─────────────────────────────────────────┐
              │          service-worker.js              │
              │                                         │
              │  • webRequest backup capture            │
              │  • Storage management                   │
              │  • Payload decoding                     │
              │  • Data persistence (24h)               │
              └─────────────────────────────────────────┘
                                    │
                                    ▼
              ┌─────────────────────────────────────────┐
              │              popup.js                   │
              │                                         │
              │  • Tabbed UI (Overview/Events/Network)  │
              │  • Real-time updates                    │
              │  • Decoded payload display              │
              └─────────────────────────────────────────┘
What I’d Do Differently
- Use TypeScript – The codebase grew larger than expected. Type safety would have caught several bugs earlier.
- Add unit tests – The encoding/decoding logic and deduplication logic are perfect candidates for testing.
- Build a “record session” feature – Export all captured data for sharing with team members.
Conclusion
Building this extension taught me that browser extensions are surprisingly powerful—and surprisingly complex. The ability to intercept network requests before they’re sent, run code in the page’s context, and persist data across navigations makes Chrome extensions an underrated platform for developer tools.
If you’re building debugging tools, consider the dual-layer approach: inject code directly where possible, but always have a backup. And never assume your code runs first—race conditions will find you.
The extension is internal to Factors, but the patterns here apply to any analytics SDK debugger. Have questions about the implementation? Feel free to reach out!